
How years of discoveries, technical challenges, feedback, and real-world deployments transformed a simple idea into a facility intelligence platform.

How Opti-mized Came To Life
Before Opti-mized became a platform, it was a journey.
Over the years, we worked alongside hundreds of facilities, uncovering challenges, testing ideas, and discovering what was really preventing organizations from reducing costs and improving performance.
This section shares the key discoveries, lessons, and breakthroughs that ultimately shaped the vision behind Opti-mized.
 More about Opti-mized
Most facilities are losing energy in ways operators never see:
 Off-hours usage
Hidden runtime waste
Peak demand spikes
Systems operating without demand
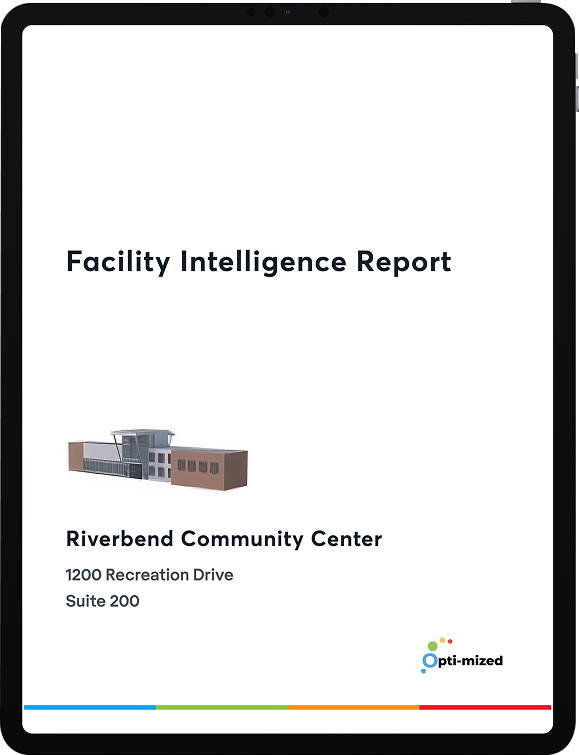
Generate a Money-Loss Report to estimate where energy may already be lost.
Get Your Free Money-Loss ReportRecurring challenges began emerging across facilities regardless of size, age, or location. Organizations consistently struggled to answer fundamental questions about energy use, operating costs, equipment performance, and facility operations.
Conversations with facility operators, managers, and municipal leaders helped validate the need for greater visibility. Many expressed similar frustrations around limited data, reactive decision-making, and the difficulty of identifying opportunities for improvement.
The first vision for Opti-mized was developed around the idea of providing greater visibility through energy monitoring. The goal was simple: help facilities better understand how they consume energy and operate while creating a foundation for smarter decision-making.
Research began into monitoring technologies, deployment approaches, communication methods, and hardware options capable of supporting the vision. Existing solutions were evaluated to better understand their strengths, limitations, and suitability for facility-wide deployment.
The journey behind Opti-mized began with a simple observation. While facilities were becoming increasingly complex, the people responsible for operating them often lacked the visibility needed to fully understand what was happening inside their buildings. Conversations with facility operators, managers, and municipalities repeatedly revealed the same challenge: important decisions were being made with limited information.
At the time, most organizations relied on utility bills, periodic audits, building automation systems, and reactive investigations to understand facility performance. While these approaches provided some insight, they rarely explained where energy was being consumed, what equipment was driving costs, or where opportunities for improvement existed. As these discussions continued, the concept behind Opti-mized began to take shape.
The concept moved beyond planning and into real facilities for the first time. Early deployments focused on validating the technology, testing installation approaches, and understanding how facilities interacted with monitoring systems.
Commercially available monitoring equipment was deployed to begin collecting facility data. While these systems helped prove the concept, they also exposed limitations around flexibility, scalability, deployment complexity, and the depth of information available.
Meaningful data streams began flowing from pilot facilities. For the first time, operational trends, energy patterns, and equipment activity could be observed over extended periods, providing valuable insight into how facilities actually operated.
A significant realization emerged. While energy monitoring provided useful information, it often failed to explain what was actually happening inside a facility. The data showed outcomes, but rarely explained the causes behind them.
With the concept established, attention shifted toward validating whether it could work in the real world. Early pilot deployments provided the first opportunity to collect meaningful facility data, test assumptions, and evaluate available technologies. These deployments would ultimately reveal both the potential and limitations of the original approach.
Throughout the year, facilities began providing valuable feedback while data started flowing from real operating environments. Although the results were encouraging, an important discovery began emerging: monitoring total facility energy consumption provided useful information, but rarely provided the level of clarity facility operators were actually looking for.
Development began on the first custom monitoring platform. Building proprietary hardware allowed greater control over data collection, deployment flexibility, communication methods, and future platform capabilities.
Participation expanded to approximately 15 municipalities and 50 facilities. Additional deployments introduced new facility types, operating environments, and challenges, helping accelerate both learning and platform development.
Development shifted toward understanding individual circuits and equipment rather than viewing facilities as a single energy consumer. This created a significantly deeper level of visibility into how buildings actually operated.
One of the most important discoveries of the entire journey emerged. Understanding individual systems and circuits provided significantly greater insight than whole-building energy monitoring alone, fundamentally changing the direction of future development.
As deployments expanded, so did the understanding of the challenge. While whole-building monitoring highlighted trends and opportunities, it rarely explained what systems, equipment, or operating conditions were responsible for them. This realization fundamentally changed the direction of the platform.
Rather than focusing solely on how much energy a facility consumed, attention shifted toward understanding individual circuits, equipment behavior, and operational context. Many of the intelligence capabilities that define Opti-mized today can trace their origins back to discoveries made during this year.
Building on lessons learned from early deployments, Meter Version 2 was introduced with improvements to reliability, deployment flexibility, communication capabilities, and overall performance. The new hardware provided a stronger foundation for future growth and more advanced intelligence capabilities.
Development began on methods for identifying and understanding individual circuits. Rather than viewing a facility as a single energy consumer, the platform started analyzing how specific systems and equipment behaved throughout the day.
The platform began interpreting operating patterns and equipment behavior instead of simply displaying measurements. This allowed the system to start distinguishing between normal operation, inefficiencies, and unusual activity.
Participation expanded to approximately 40 municipalities and 150 facilities. The increasing diversity of facilities provided valuable feedback and helped validate many of the discoveries and assumptions made throughout development.
2023 marked one of the most significant turning points in the evolution of Opti-mized. Up until this point, much of the focus had been on collecting, organizing, and visualizing facility data. Through continued deployments and collaboration with facility operators, it became increasingly clear that data alone was not enough. Facilities needed context, interpretation, and actionable intelligence.
This realization shifted development toward understanding equipment behavior, identifying operational patterns, and uncovering opportunities hidden within the data. By the end of the year, the platform had begun evolving from a monitoring solution into an intelligence platform capable of helping facilities understand not only what was happening, but why it was happening.
Development focused on identifying inefficiencies and opportunities that traditional monitoring systems often miss. New analytical approaches were introduced to help uncover hidden energy loss occurring across equipment, schedules, and facility operations.
The third generation of hardware was introduced following years of field experience and feedback. Improvements focused on scalability, deployment efficiency, reliability, communication flexibility, and long-term platform growth.
Development expanded beyond energy consumption and operational visibility into understanding asset performance and equipment behavior. New capabilities were introduced to better identify abnormal conditions, performance changes, and emerging issues.
The platform surpassed approximately 70 municipalities and 300 facilities. This continued growth provided a broader range of facility types, operating conditions, and data sources, helping further refine the intelligence behind the platform.
As participation continued to grow, the challenge shifted from developing intelligence to delivering it at scale. The platform was now collecting significantly larger volumes of data from a growing number of facilities, equipment types, and operating environments. New hardware, analytics, and intelligence capabilities were introduced to support this expansion while continuing to improve the quality of insights being delivered.
Throughout the year, development expanded beyond energy monitoring and operational visibility into asset intelligence, contextual analysis, and more sophisticated detection capabilities. By the end of the year, Opti-mized had evolved into a platform capable of supporting hundreds of facilities while continuously improving its understanding of facility operations.
Years of development began converging into a unified platform. Energy insights, equipment intelligence, operational analytics, asset monitoring, and facility-wide visibility were brought together into a single ecosystem designed to support facility owners and operators.
Municipal adoption continued to expand as more organizations sought better visibility into their facilities. By this stage, the platform had been refined through years of feedback, allowing deployments to occur more efficiently and consistently across a diverse range of municipal environments.
The platform reached 500+ facilities spanning recreation centers, arenas, municipal offices, public works facilities, water and wastewater infrastructure, community centers, and other municipal assets. This growing portfolio continued strengthening the intelligence and experience behind the platform.
After five years of continuous development, Opti-mized emerged as the result of hundreds of deployments, technical innovations, discoveries, and real-world lessons. The platform now provides organizations with a deeper understanding of facility performance, equipment behavior, operational opportunities, and asset health than was originally thought possible.
By 2025, the vision that first emerged years earlier had evolved into something far greater than originally imagined. Through hundreds of deployments, countless conversations, technical breakthroughs, and real-world lessons, Opti-mized had matured into a comprehensive facility intelligence platform designed to help organizations better understand, operate, and improve their facilities.
What began as an effort to provide greater visibility into energy consumption had expanded into a platform capable of delivering energy intelligence, asset intelligence, operational intelligence, and portfolio-wide insights. Every challenge solved, every facility deployed, and every discovery made contributed to shaping the platform that exists today.
This report shows you where it’s happening, what’s causing it, and how to fix it.
Get Your Free Money-Loss Report
Get Your Free Money-Loss Report
Stay Informed
Get early access to insights, product updates, and new opportunities to better understand and improve facility performance.
By subscribing, you agree to Opti-mized’s Terms & Conditions and Privacy Policy.