
Everything Starts Here
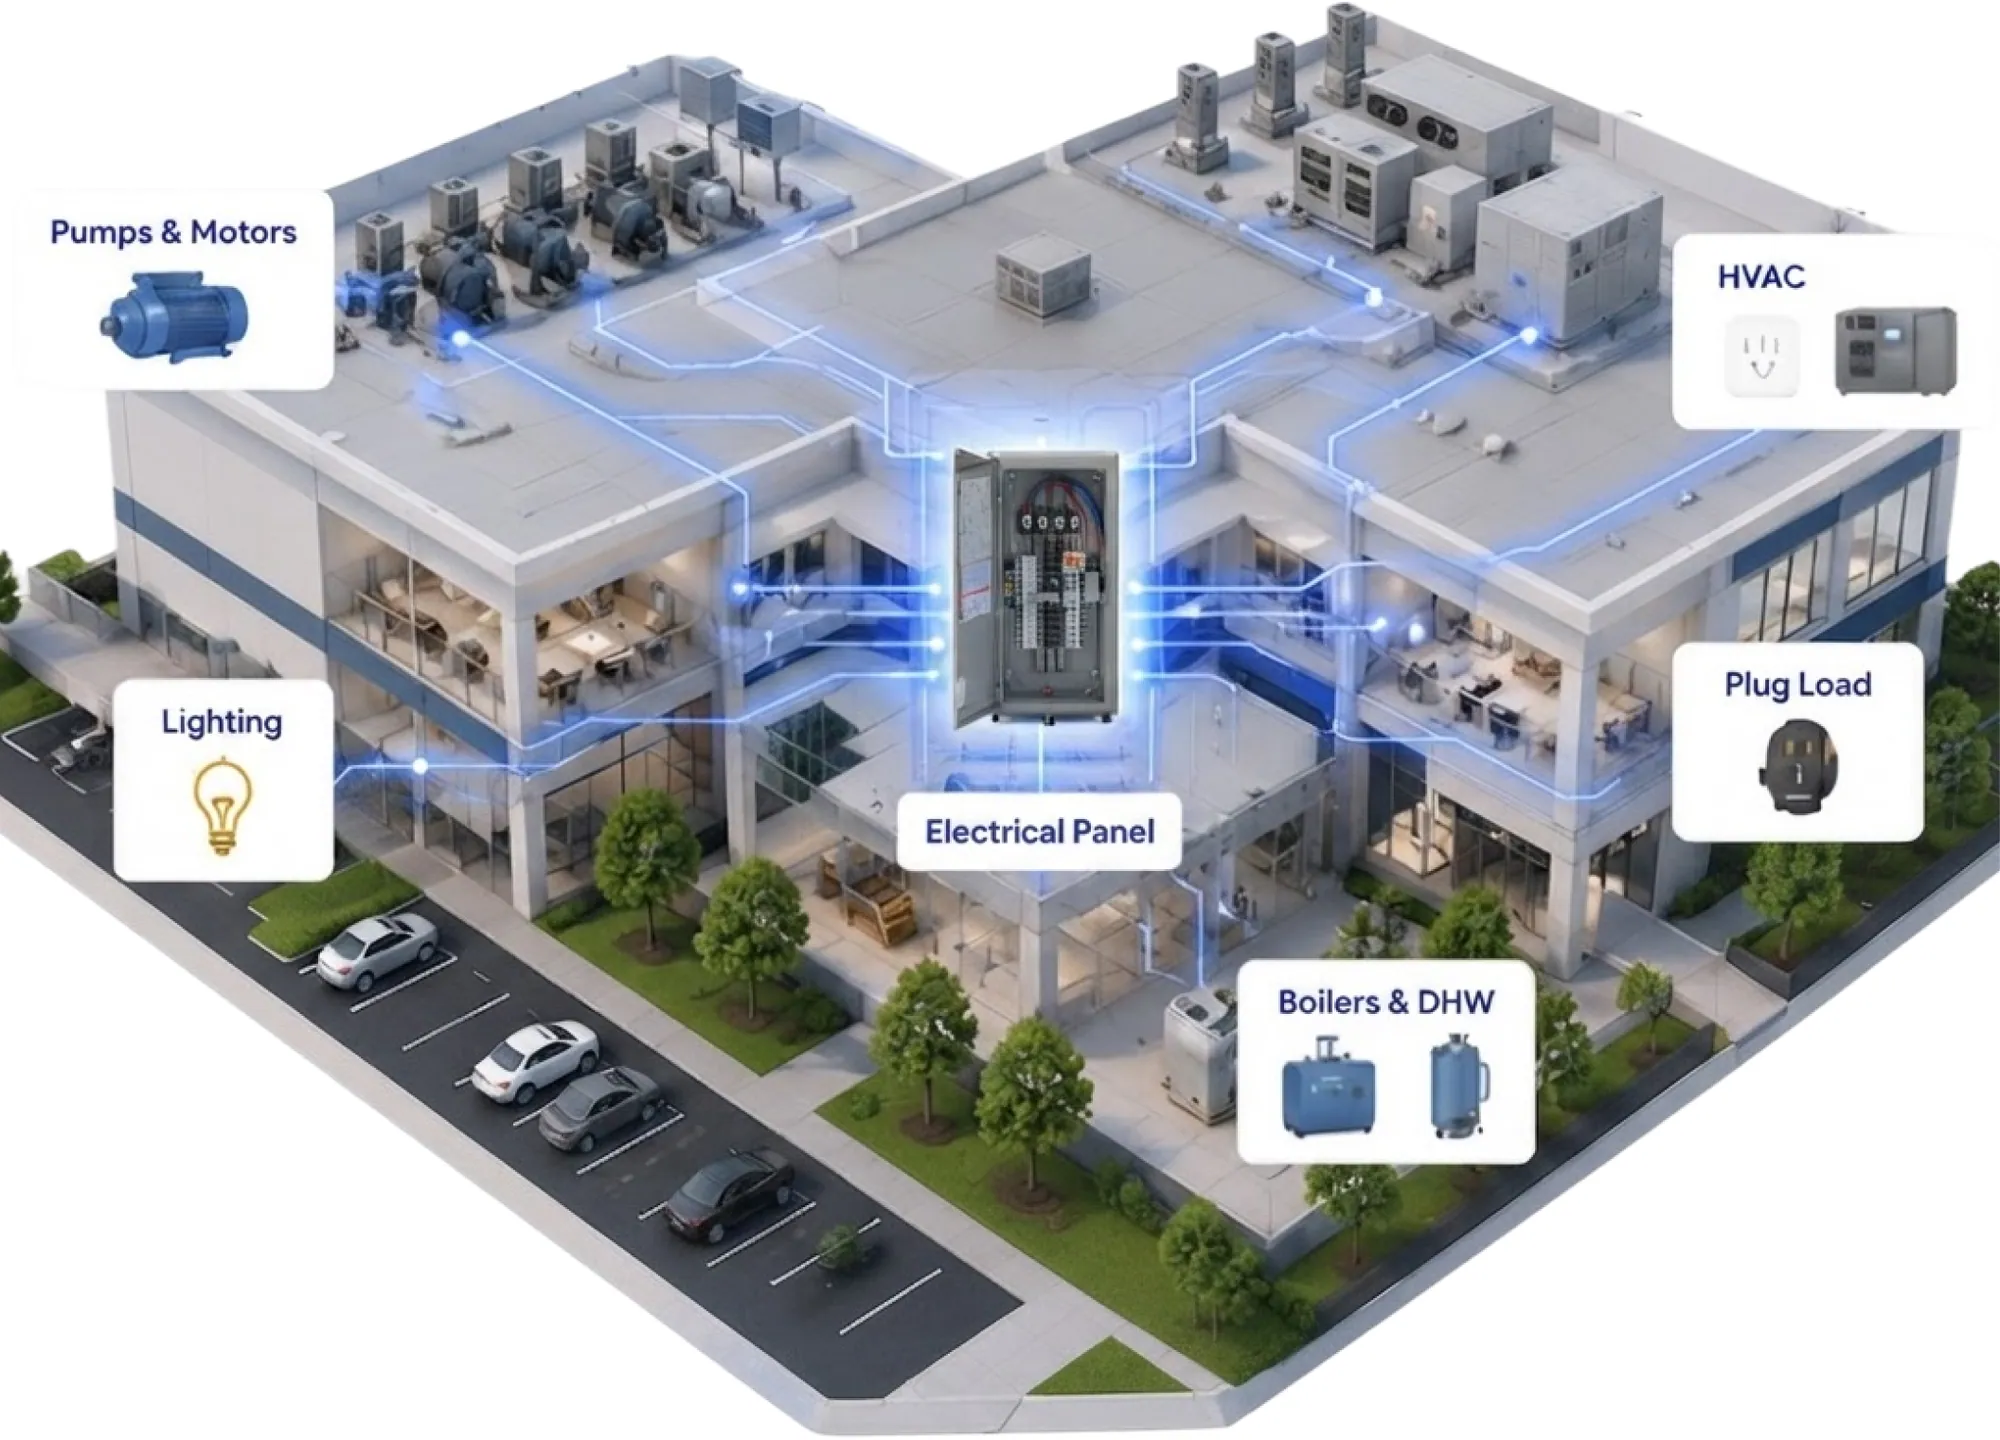
Nearly every system that consumes energy or impacts operating costs is connected to an electrical panel, MCC, or switchgear.
 Quick to DeployInstall in hours, not days.
 Non-IntrusiveClip-on sensors. No cutting wires.
 Works with Any FacilityPanels, MCCs & Switchgear.
 Secure by DesignEnterprise-grade data security.
From Panel Data to Better Decisions
 01
Capture Activity
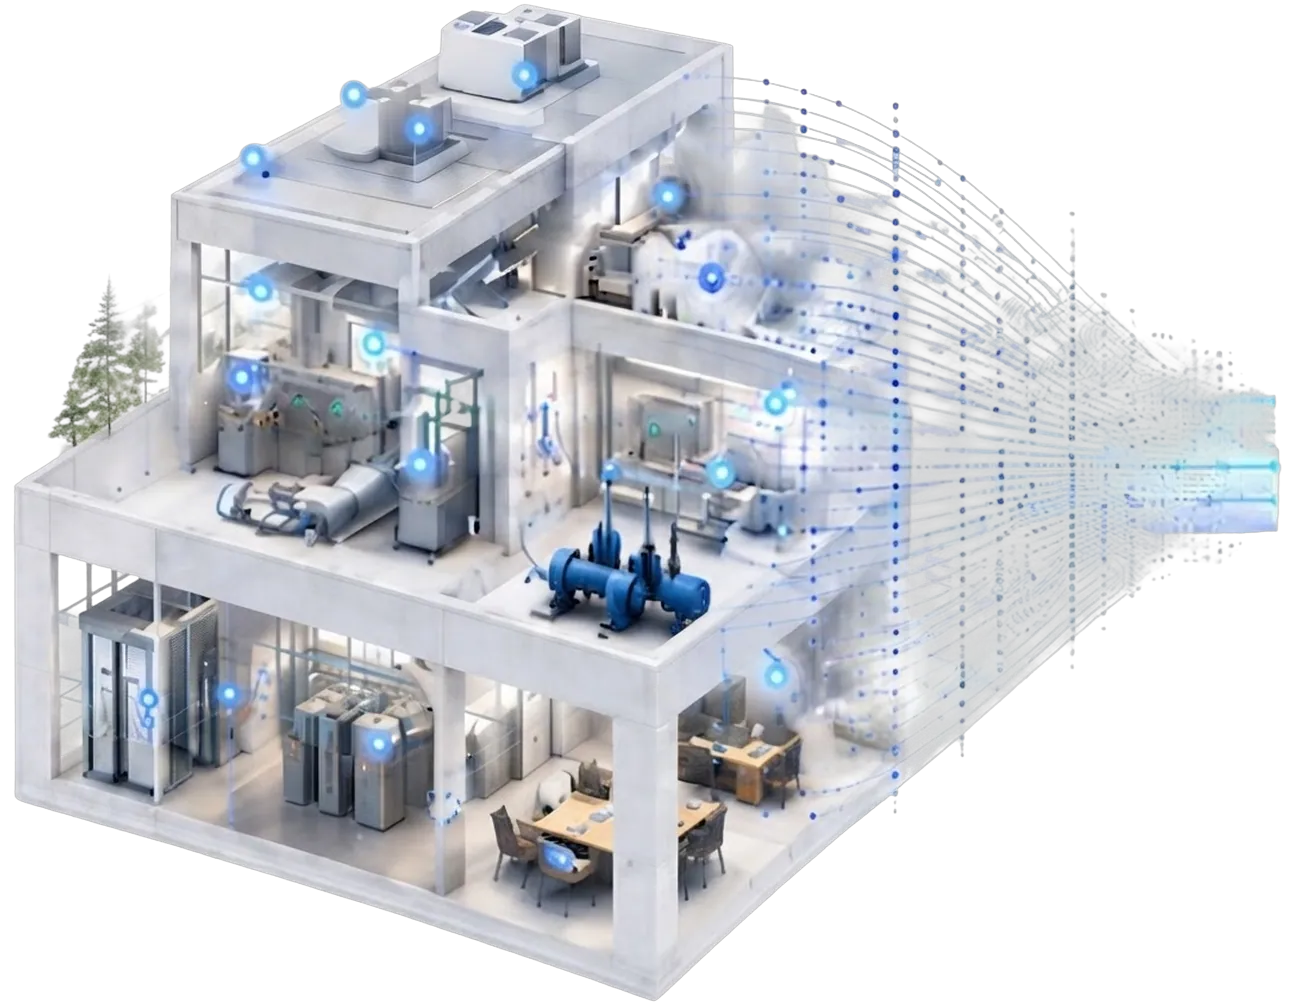
Sensors capture real-time electrical activity.
 02
Create Visibility
We turn data into clear, actionable insights.
 03
Identify Opportunities
Uncover energy loss, risks, and optimization potential.
 04
Make Better Decisions
Prioritize what matters and drive measurable results.
Get your facility’s full breakdown, in 6 quick questions
Get Your Free Money-Loss Report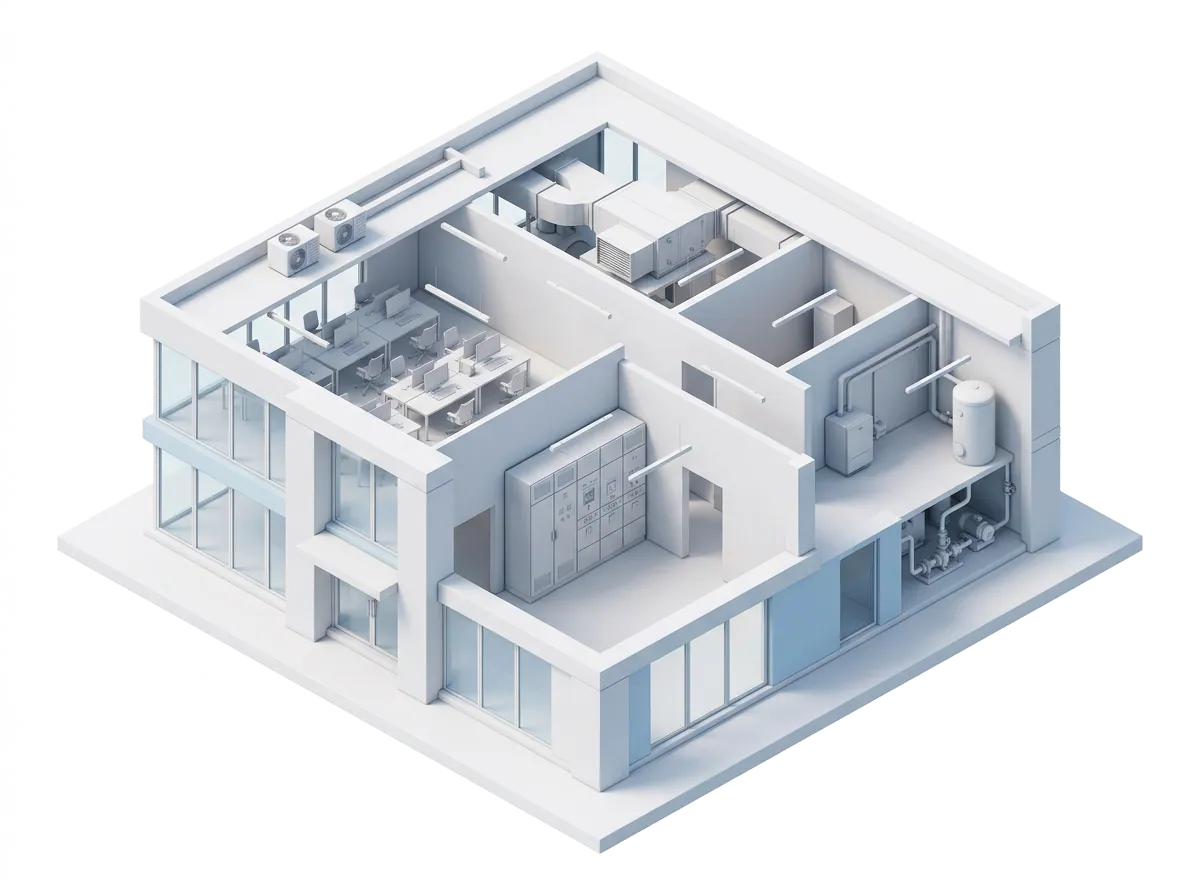


 Electrical Panel
Opti-mized Gateway
It Starts At The Source
Every system that consumes energy or impacts operating costs receives power through an electrical panel, MCC, or switchgear.
Opti-mized captures electrical activity directly from the source, creating a real-time picture of how equipment and systems are operating throughout the facility.
Facility Overview
Main Panel · Today
HVAC38%Lighting24%Pumps & Motors21%Plug Load17%See What’s Actually Happening
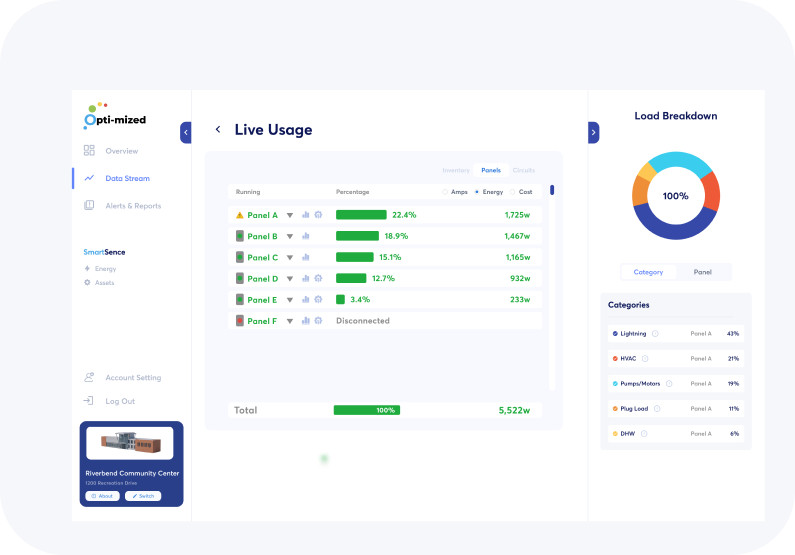
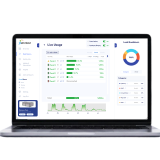
The captured activity is organized into a simple, easy-to-understand dashboard that provides visibility into energy usage, equipment operation, and facility performance.
No more relying solely on utility bills or assumptions.
Operating Behavior
Main Panel · Last 24 hours
- After-hours HVAC · $8,160/yrOPPORTUNITY
- Peak demand driver
- Pump runtime +28%
3 opportunities identified from operating patterns
Turn Visibility Into Intelligence
Once facility activity becomes visible, the platform begins analyzing operating behavior to identify energy loss, operational inefficiencies, abnormal equipment behavior, and opportunities for improvement.
This is where data becomes intelligence.
Clear Answers. Not More Data.
Instead of guessing where money is being spent or which systems require attention, facilities gain clear insights that support better operational, maintenance, and energy management decisions.
The result is a facility that is easier to understand, easier to operate, and easier to improve.
A day in your facility
We watch everything. You act on what matters.
Illustrative example. Drag the timeline.
- Peak Demand Driver Demand spike caused by simultaneous equipment startup Est. Savings $5,420 / year
- Pump Behaviour Change Pump runtime increased 28% over baseline Status Investigate
- After-Hours HVAC Detected AHU-3 operating 5.4 hours after occupancy Est. Savings $8,160 / year
From Panel to Intelligence
A simple view of how data flows from your facility into Opti-mized.
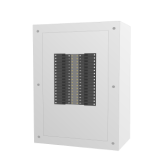 1
Panel
Where electrical activity begins.
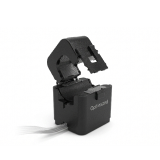 2
Sensors
Capture circuit-level activity.
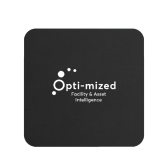 3
Expansion
Brings sensors together.
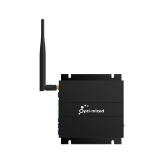 4
Gateway
Collects and transmits data.
 5
Cloud
Secure cloud sync.
 6
Intelligence
Operational insights delivered.
See How Much Energy You’re Losing — And How Much You Can Recover
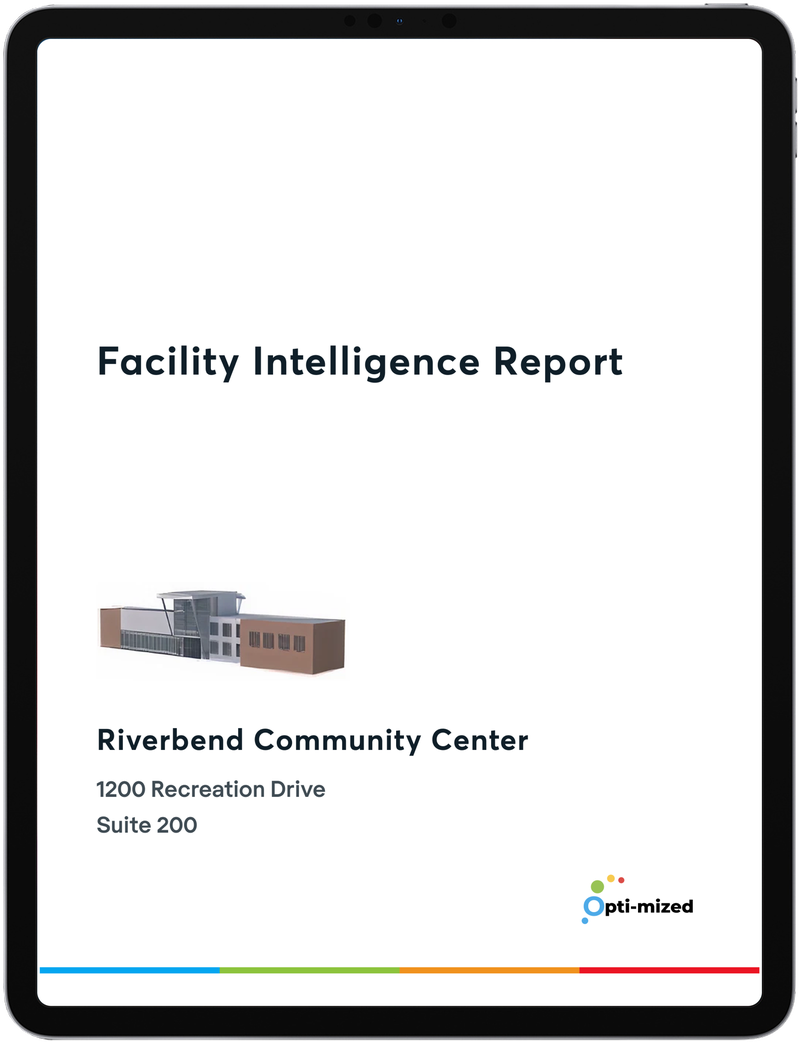
Get a personalized Money-Loss Report showing where energy is likely going, what’s causing it, and the biggest opportunities for savings.
 Energy Use
Breakdown Operational
Insights Savings
Opportunities
Free · No hardware required · Takes only a few minutes
 Hidden Cost DetectedMost facilities are wasting roughly 5–20% of their energy spend without knowing it.