
 Energy Intelligence
Find the money your facility is quietly wasting.
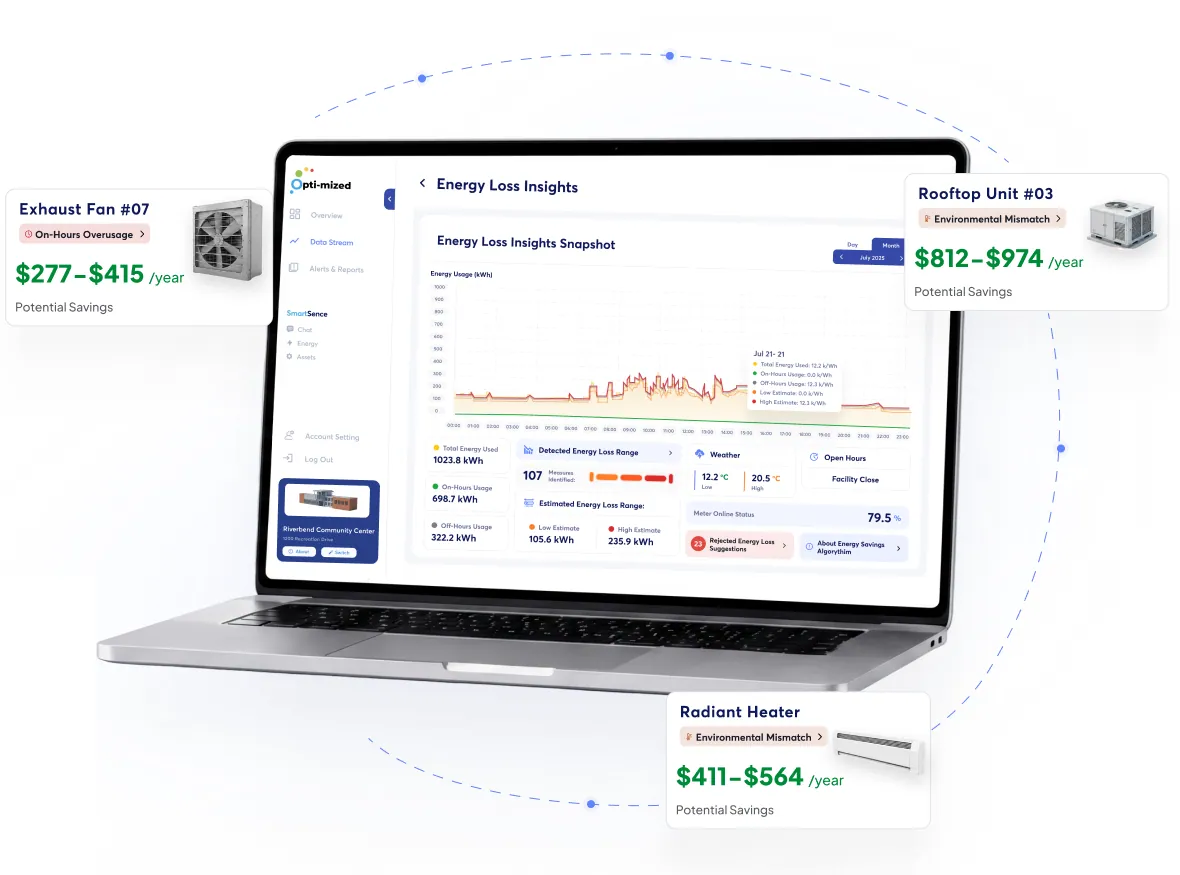
Energy Intelligence searches your facility for savings every second, so you don’t have to.
Nobody has time to dig through every system, every day, looking for waste. Energy Intelligence does it for you, in the background.

You get the answer, not more data.
It checks how your equipment runs against your schedules and the weather, then tells you what’s wasting money, why, and what to do about it.
 Sees every secondDay and night, all year.
 Tells you what to fixRanked by what it’s worth.
 No extra workRuns in the background.
How it finds savings in your facility
We set it up for your facility first. So every finding fits how your facility actually runs.
-
We set it up for your facility
We map your facility so the system knows exactly what it’s looking at.
 Panels Identified
 Every Panel Connected
 Equipment Identified
 Operating Hours Configured
-
It learns what “normal” looks like
Schedules, weather and how your equipment should run, so it knows normal from waste.
 Operating PatternsHow systems should normally run
 Facility SchedulesWhen your facility is open and closed
 Live WeatherReal-time conditions that affect performance
-
It finds the waste
Readings every second, checked against what should be happening. Automatically.
 Detects Energy LossSees exactly where money is being wasted
 Explains What’s Driving ItUnderstands why it’s happening
 Surfaces Savings OpportunitiesBiggest wins first
-

You get a clear to-do list
What to fix, why, and what it’s worth, biggest first.
Example data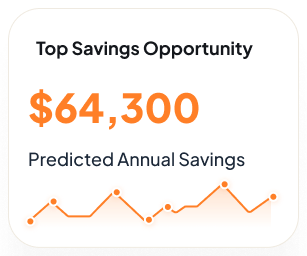
 Opportunities ranked
 Across every system

Setup is the secretThe detail we capture on day one is what makes every finding accurate, every day after.

Built for your facilityKnows your systems. Fits how you run. Points to what matters.
- It sees your facility every second.
- It knows what normal looks like.
- It spots waste as it happens.
- It tells you what to fix first.
You stop hunting for savings. They come to you.
Seven ways facilities waste money
Energy Intelligence sorts every finding into one of seven types, so you know what’s happening and where to act.
Off-Hours Usage
Using Energy Outside Normal Operational Hours
Opti-mized helps identify equipment and systems that continue consuming energy outside scheduled operational hours — revealing unnecessary runtime and avoidable operating costs.
- Runtime After Hours

- Unexpected Overnight Operation

- Schedule-Related Waste



Off-Hours Usage
Estimated annual impact
$2.9K-4.2K
/year
Based on detected operating patterns

53 Detected Areas

Top contributors

HVAC Running After Hours

Detected

Lighting Left On After Hours
Detected

Plugged-In Equipment Left On
Detected

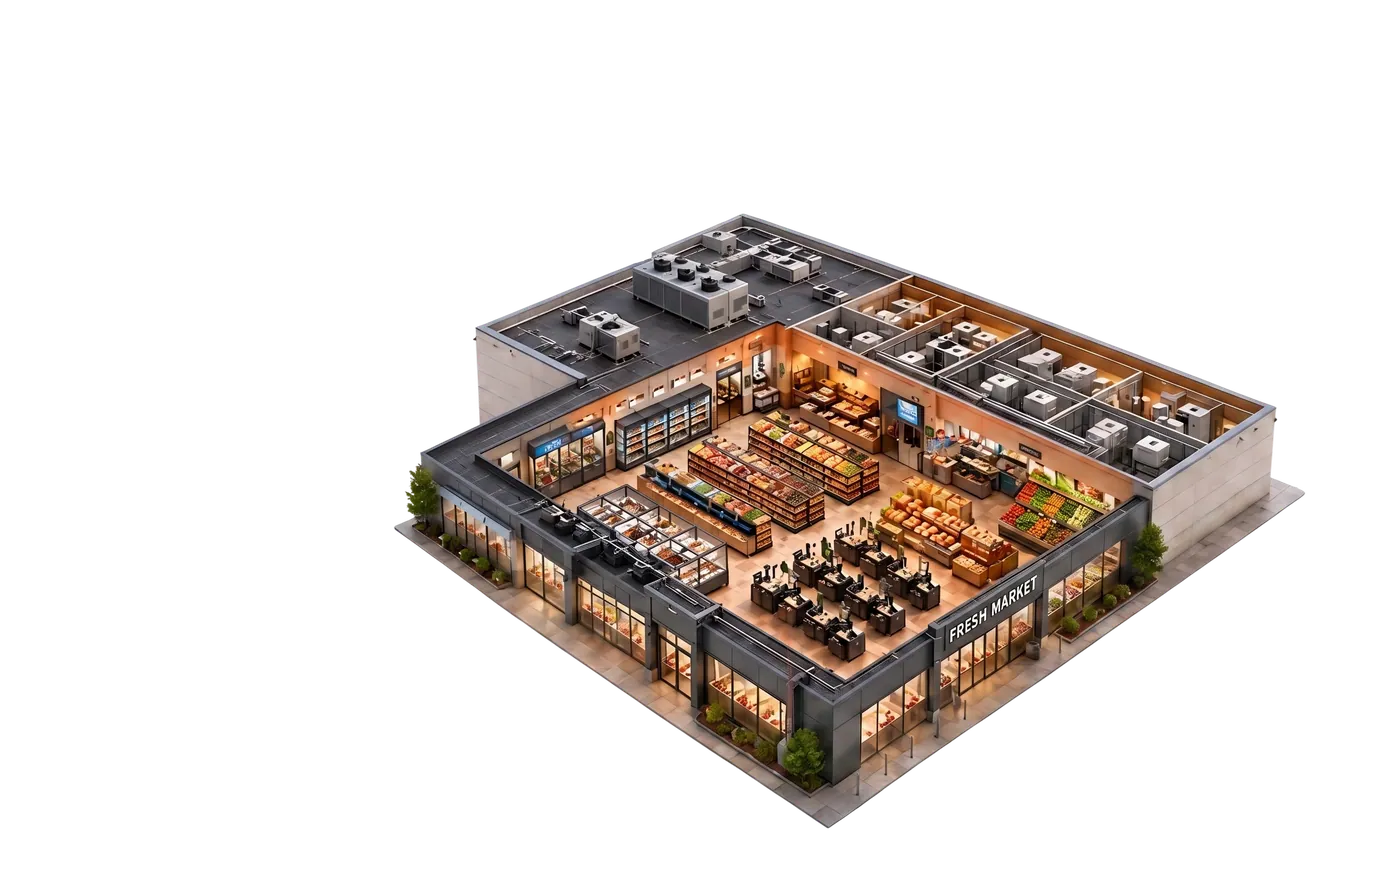
On-Hours Overuse
Using More Energy Than Necessary During Operational Hours
Opti-mized helps identify equipment and systems that are consuming more energy than necessary during normal operational hours — uncovering avoidable costs that can otherwise go unnoticed.
- Extended Runtime During Operations

- Higher-Than-Necessary Energy Use

- Unnecessary Concurrent Operation


On-Hours Overuse
Estimated annual impact
$4.5K-7.2K
/year
Based on detected operating patterns

24 Detected Areas
Top contributors
Rooftop HVAC & Make-up Air
Detected

Refrigeration Systems
Detected

Food Prep & Service Equipment
Detected

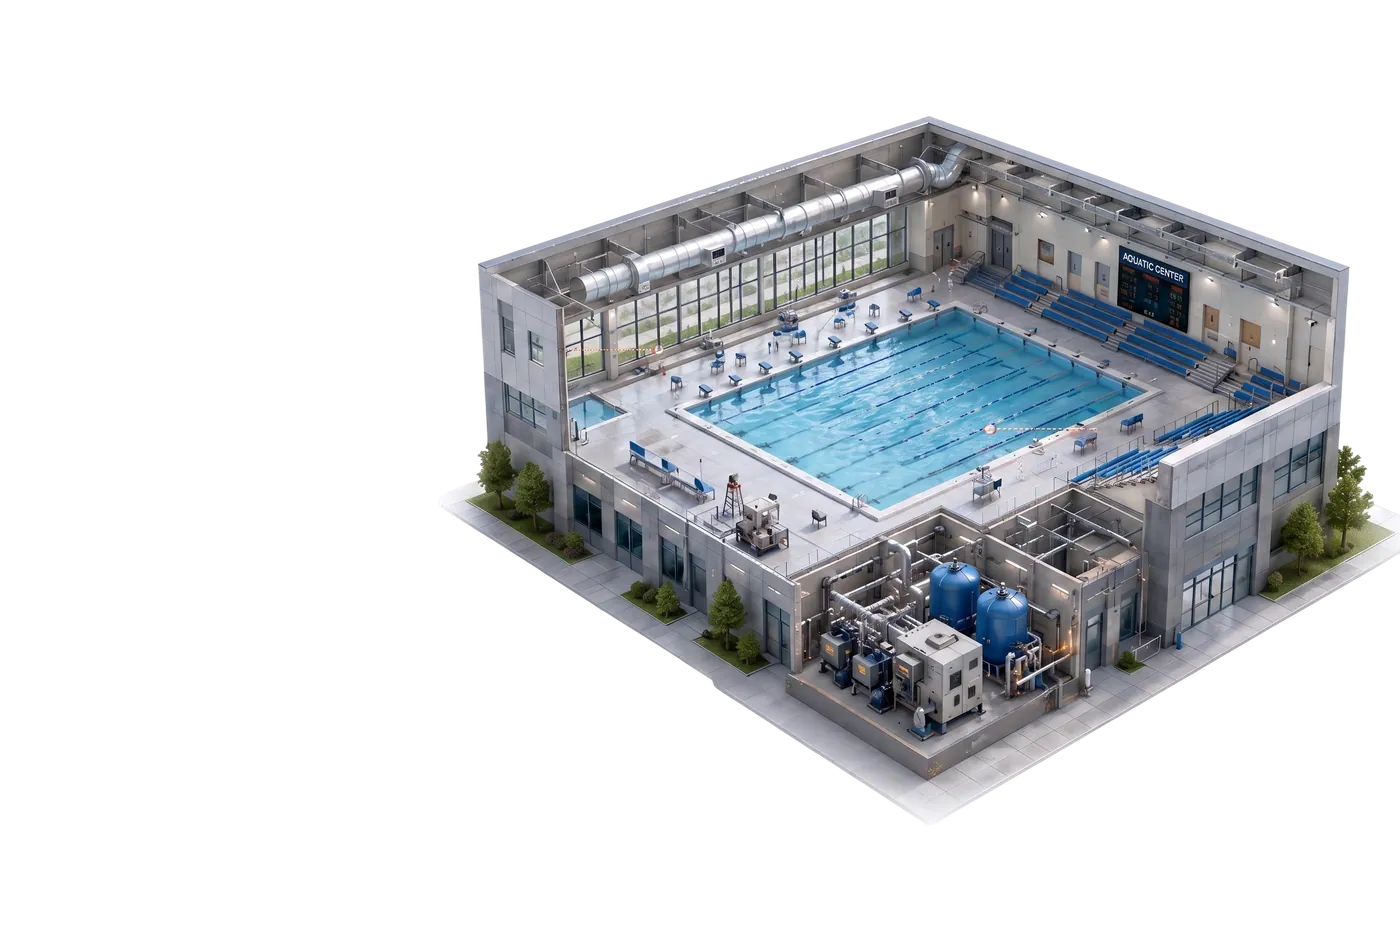
Environmental Mismatch
Operating Conditions That Don't Match the Environment
Opti-mized helps identify equipment and systems operating in ways that don't align with environmental conditions — revealing unnecessary heating, cooling, or runtime and the resulting avoidable costs.
- Improper Setpoints or Controls

- Simultaneous Heating & Cooling (Wasted Energy)

- Ignoring Outdoor Conditions or Occupancy


Environmental Mismatch
Estimated annual impact
$12.2K-16.6K
/year
Based on detected operating patterns

17 Detected Areas
Top contributors
Pool Heating During Mild Conditions
Detected

Excessive Dehumidification
Detected

Heating and Ventilation Working Against Each Other
Detected

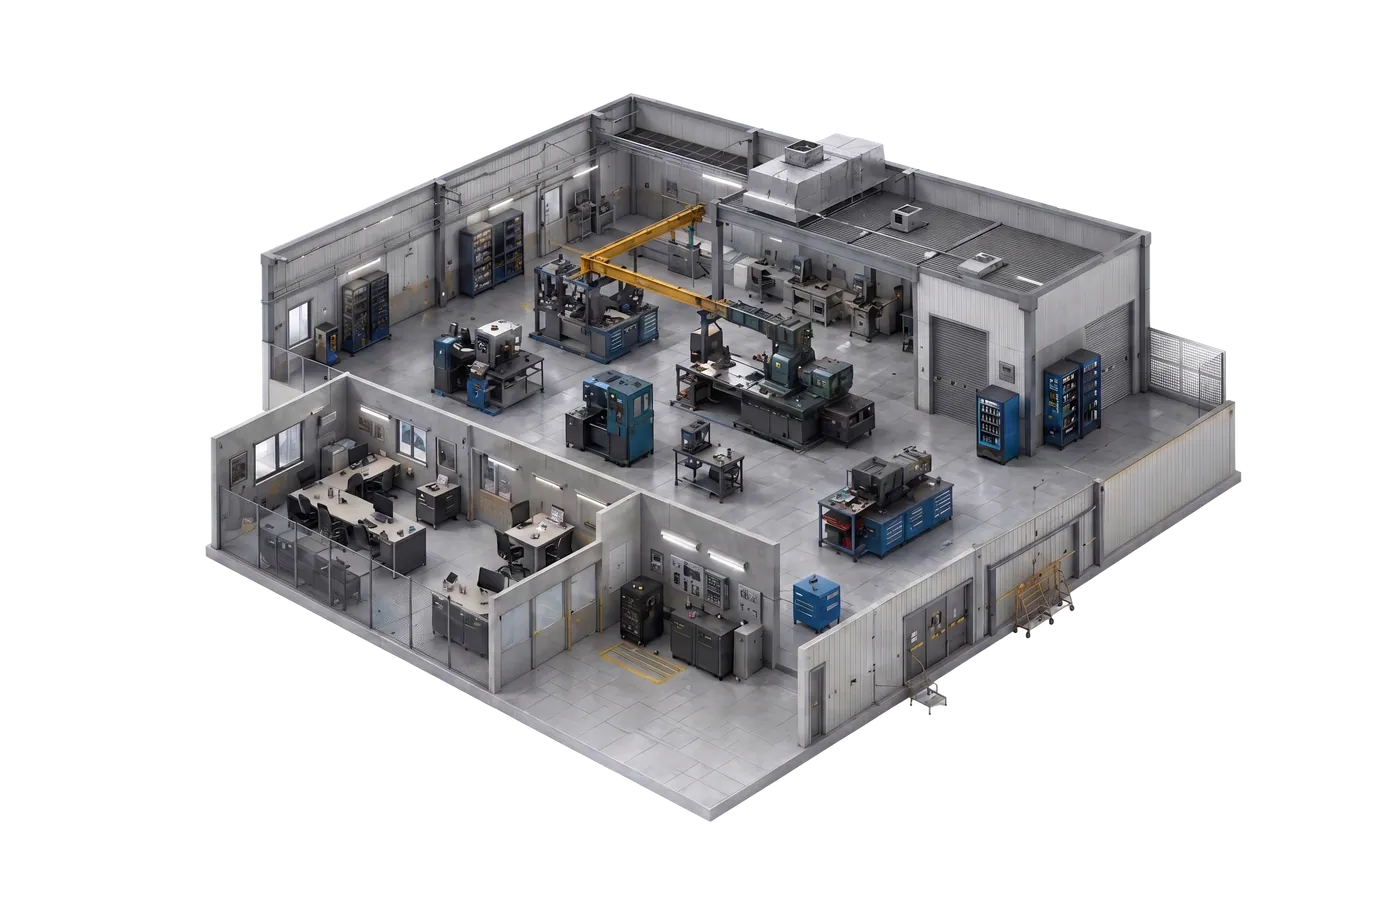
Idle / Standby Waste
Energy Used While Equipment Is Idle or on Standby
Opti-mized helps identify equipment and systems that continue consuming energy while not actively in use — revealing unnecessary standby consumption and avoidable operating costs.
- Equipment Drawing Power While Not in Use

- Always-On Equipment With No Reason to Run

- Systems Left Active Between Uses


Idle / Standby
Waste
Estimated annual impact
$1.2K-2.3K
/year
Based on detected operating patterns

21 Detected Areas
Top contributors

Air Compressors Idling Between Uses
Detected

Vehicle Lifts Remaining Energized
Detected

Shop Equipment Left in Standby
Detected

Always-On Equipment
Equipment That Runs Hard, All Day and All Night
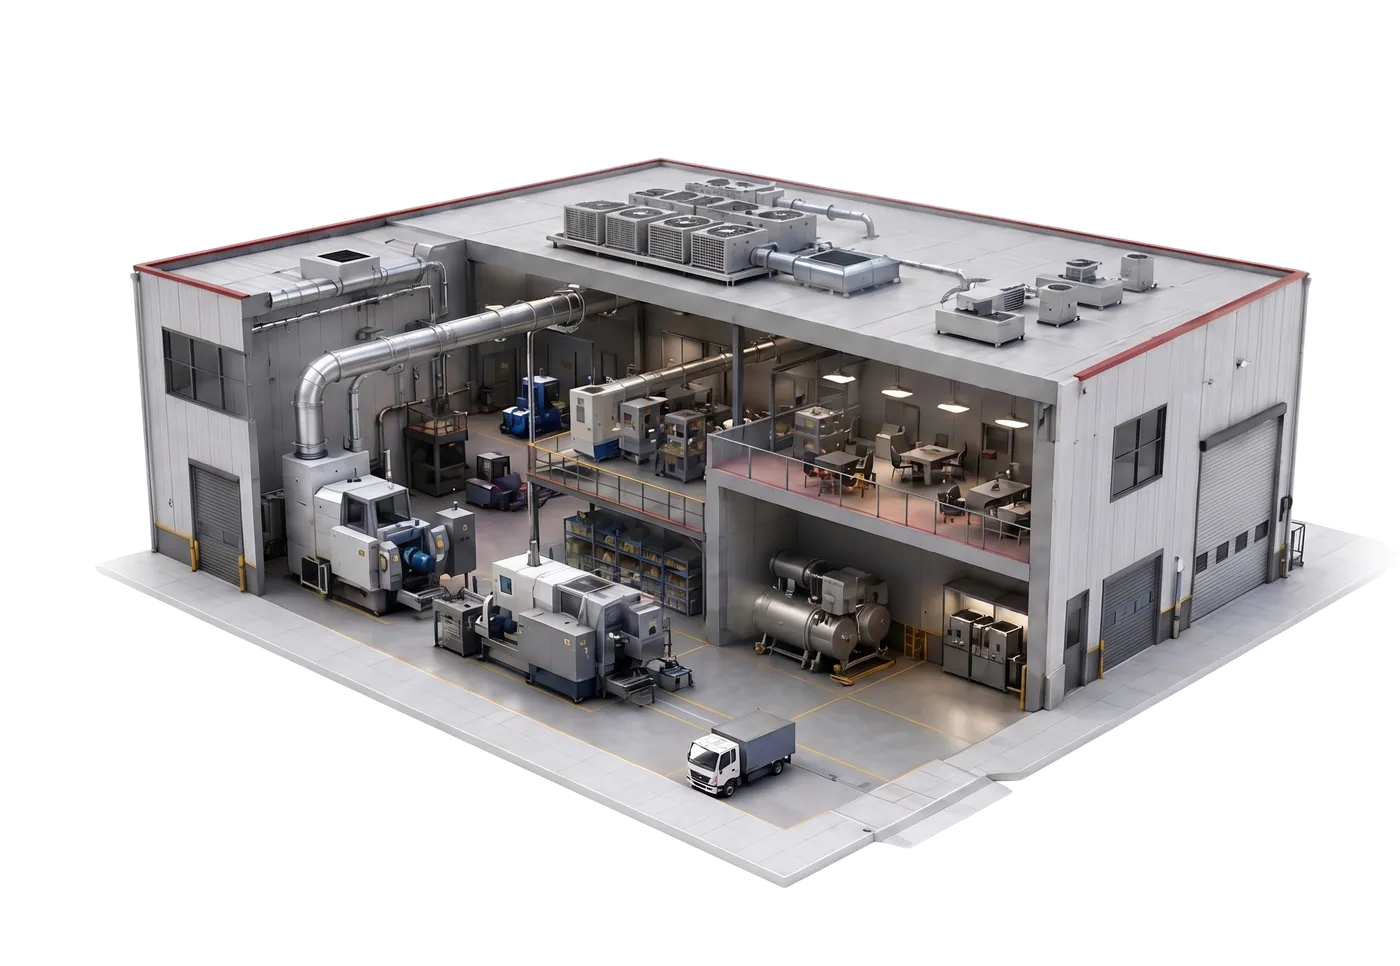
Opti-mized helps identify equipment and systems that run harder than they need to, for hours on end — revealing inefficient operation, unnecessary runtime, and avoidable operating costs.
- Running Hard for Hours on End

- Equipment Operating at Elevated Output


- Base Load Remaining Unusually High


Always-On Equipment
Estimated annual impact
$1.9K-2.6K
/year
Based on detected operating patterns

31 Detected Areas
Top contributors

Conveyor Systems Running Continuously
Detected

Ventilation Fans Running Flat Out
Detected

Warehouse Lighting Left Fully On
Detected

Peak-Time Spikes
Equipment That Spikes Your Bill at the Busiest Times
Opti-mized helps identify which equipment and systems are running at your facility's busiest, most expensive times — and what could be shifted or switched off.
- Big Equipment Running at the Busiest Times

- Big Equipment Adding to Peak-Time Costs

- Simultaneous Operations Creating Peak Demand

Retrofit Savings
More Confidence in Retrofit Savings
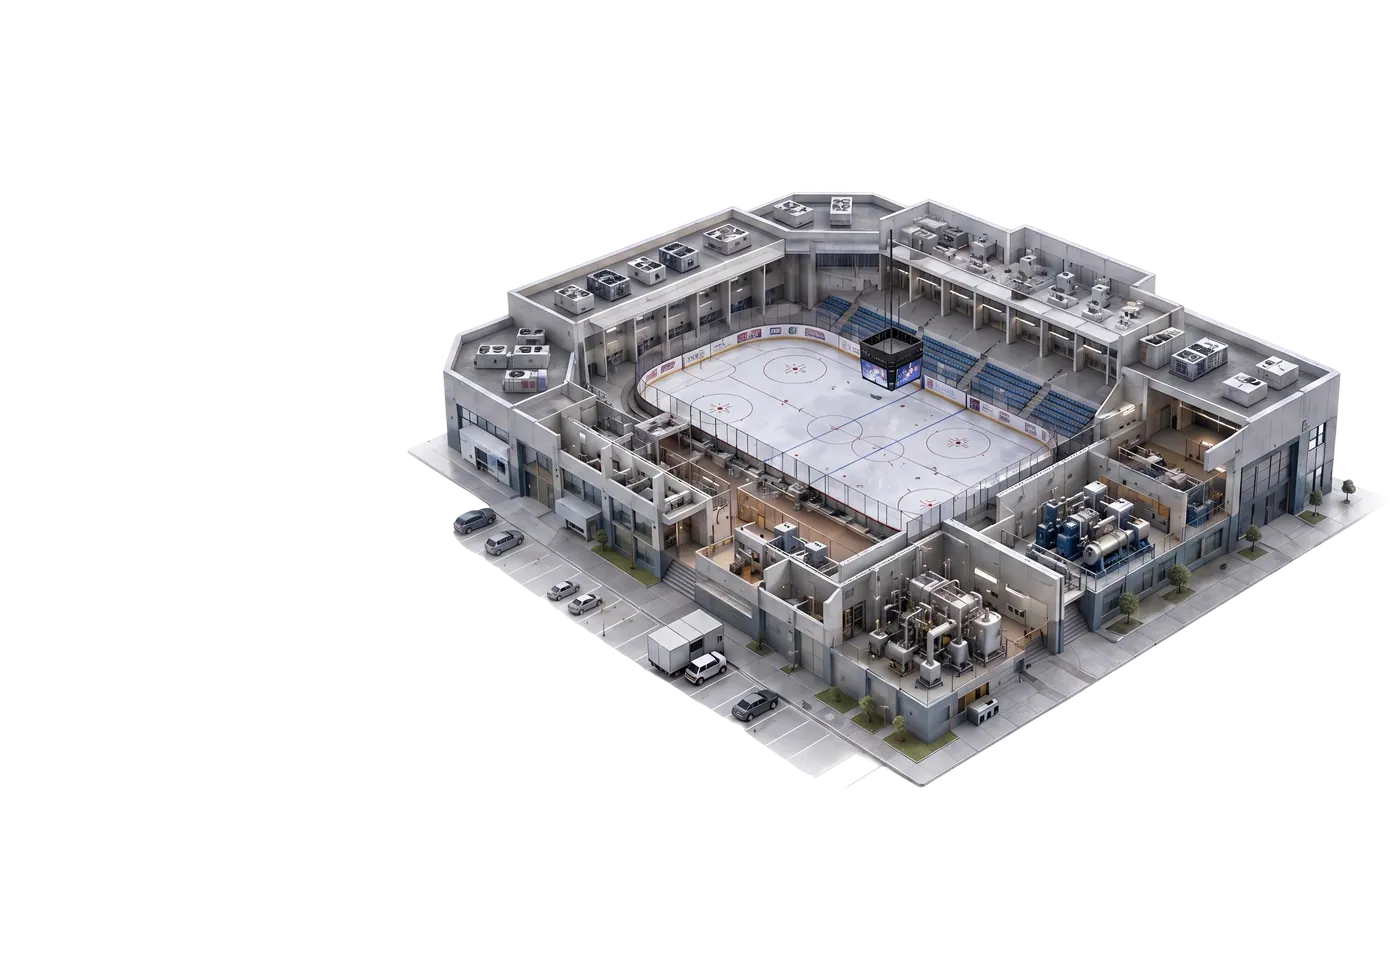
Opti-mized uses detailed equipment performance data to help model how proposed retrofits would perform under actual operating conditions — creating more informed savings estimates and clearer investment decisions.
- Get the knowledge and data to evaluate retrofit opportunities with confidence.

- Run simulations and calculations before making a big investment.

- Get real information. Be informed. Make data-backed decisions.




 The whole picture
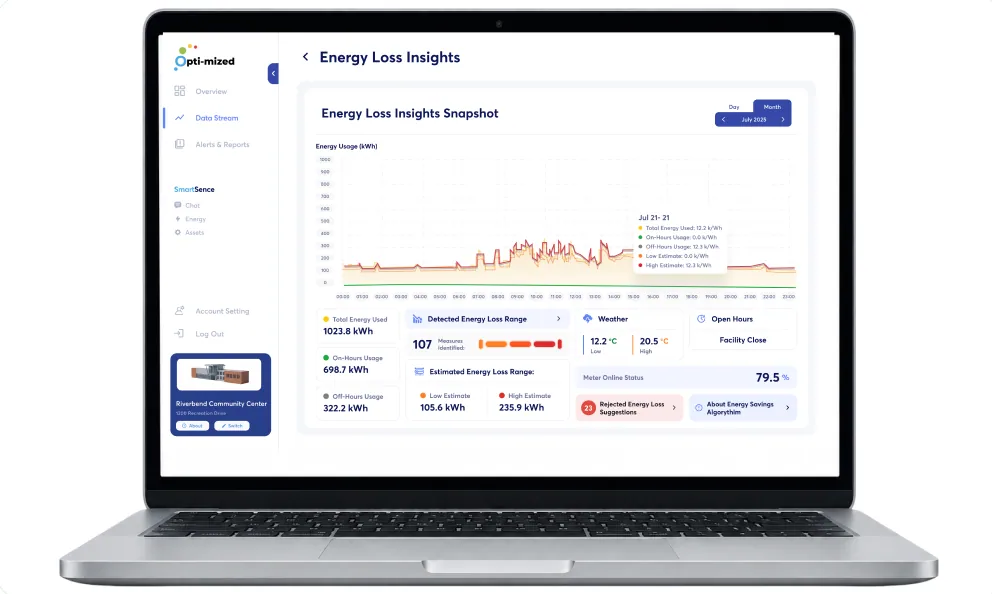
Every saving in your facility, on one screen
How much you could save, which fixes matter most, and what’s causing each one.
See the Big Picture
See your facility’s total savings potential and the top opportunities in one view.
 Total Savings PotentialSee the full amount your facility could save each year.
 Where Savings AreBreak down savings by category and see which areas contribute the most.
 Opportunities at a GlanceSee how many opportunities were found and which one offers the biggest impact.
Identify What Matters Most
Quickly see which opportunities offer the greatest impact, how they rank against each other, and where to focus first.
 Ranked by Savings PotentialView opportunities from lowest to highest or highest to lowest impact.
 See What’s Worth PursuingCompare categories and opportunity size to focus attention where it matters most.
 Priorities at a GlanceUnderstand which opportunities rise to the top across the facility.
Explore Every Opportunity
Drill into each opportunity to uncover what’s driving the issue, understand its impact, and take action with confidence.
 Understand the CauseSee what’s driving the issue with clear root cause insights.
 Review the ImpactUnderstand the size of the issue and the savings potential.
 See Recommended ActionsGet clear, actionable steps to fix the issue and capture savings.
 Understand Equipment
It knows how your equipment should run
So it can tell normal from waste
You can’t spot waste unless you know what normal looks like. So Energy Intelligence learns what each piece of equipment is and how it should behave.
Click here for the boring technical details
Every connection point is matched to its equipment and linked to a growing library of equipment types, facility systems and how each one normally operates.
Readings arrive every second. Each one is compared with the expected pattern for that equipment, your schedules and the live weather, and anything that doesn’t fit is flagged for a closer look.
What it already knows
 Lighting Systems
Expected operating schedules, runtime patterns, and energy usage characteristics.
 HVAC Equipment
Heating and cooling schedules, and how the weather should change the way it runs.
 Pumps & Motors
Runtime, cycling patterns, and continuous operation characteristics.
 Facility-Specific Assets
Equipment unique to arenas, pools, recreation facilities, public works and water treatment facilities, and more.
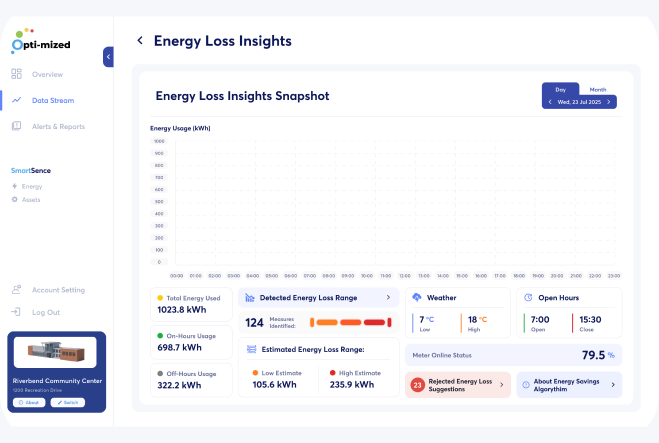 Example data
See the complete picture
 View Savings Potential
“What is my facility wasting, in total?”
Energy Intelligence gathers every finding into one facility-wide view.
You see your total savings potential and where it’s coming from, across the whole facility.
No digging through hundreds of systems. The biggest opportunities are right at the top.
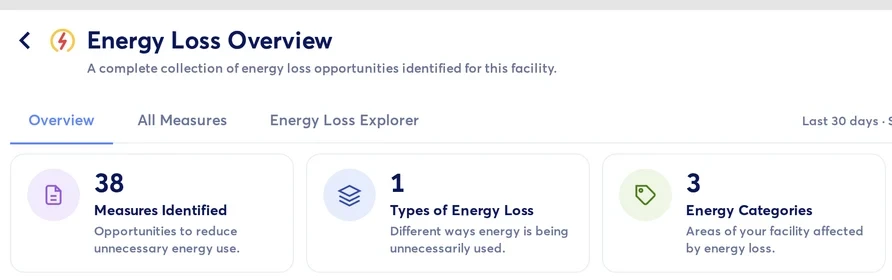
Explore each opportunity
 Explore Opportunities
Every finding opens up.
Findings are sorted by equipment, system and type of waste, so you see where money is going and why.
Open any finding to see the evidence, what it’s worth and the recommended fix.
Powerful on the inside. Simple on the outside.
- Set it and forget itInstall it once. It just keeps working.
- Quick to deployUp and running fast, without shutting anything down.
- Easy to usePlain words and clear screens. No training needed.
- Works in the backgroundYour team gets on with their day.
- Works with what you haveNo need to replace your existing systems.
- Designed for real facilitiesNew or old, small or large, simple or complex.
Find out what your facility is wasting, for free
Get your free Money-Loss Report: where your money is likely going, what’s causing it, and the biggest savings to go after first. Sent to you as a PDF by email.
 Energy Use
Breakdown Operational
Insights Savings
Opportunities
Free · No hardware needed · PDF by email
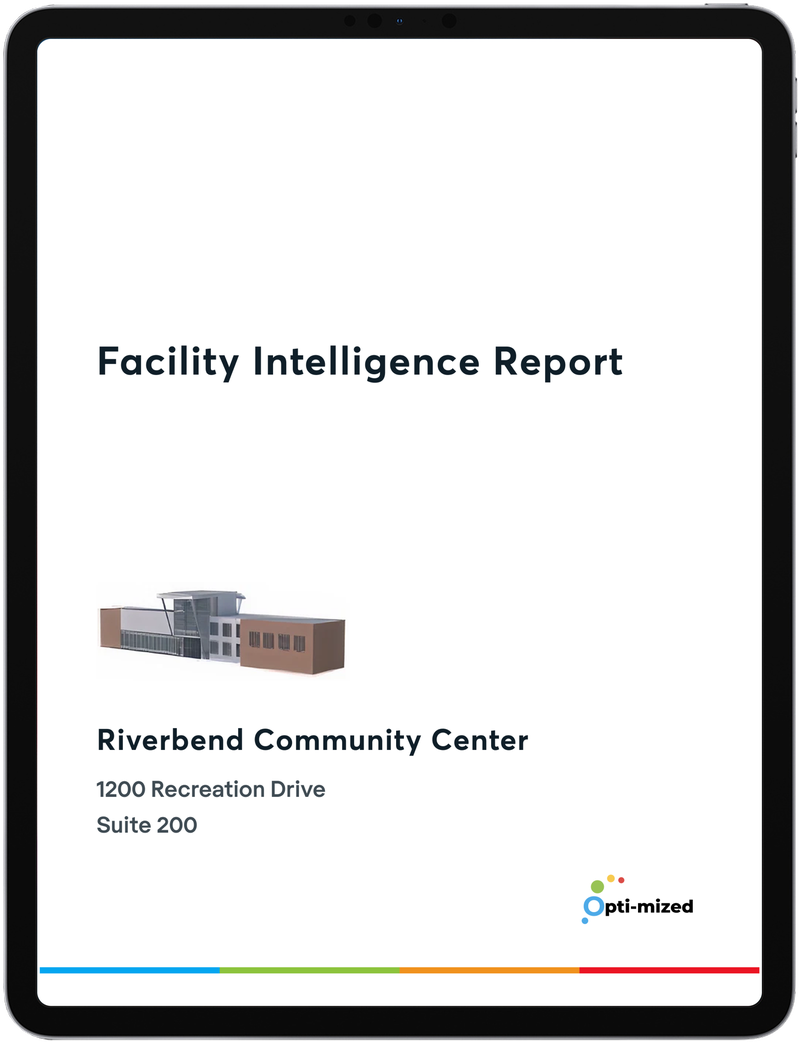
 Hidden costsWaste rarely shows up on the bill. It hides in everyday equipment.