

Skip to content

The Arena Was Running Harder Than Anyone Realized

Case Study Overview

15.9%
Energy Savings
2.3Years
ROI Period
64
Energy Loss Areas

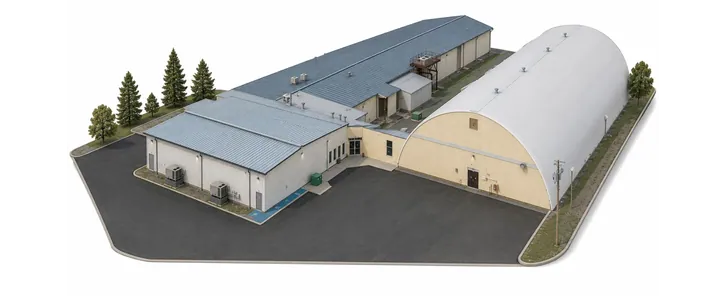
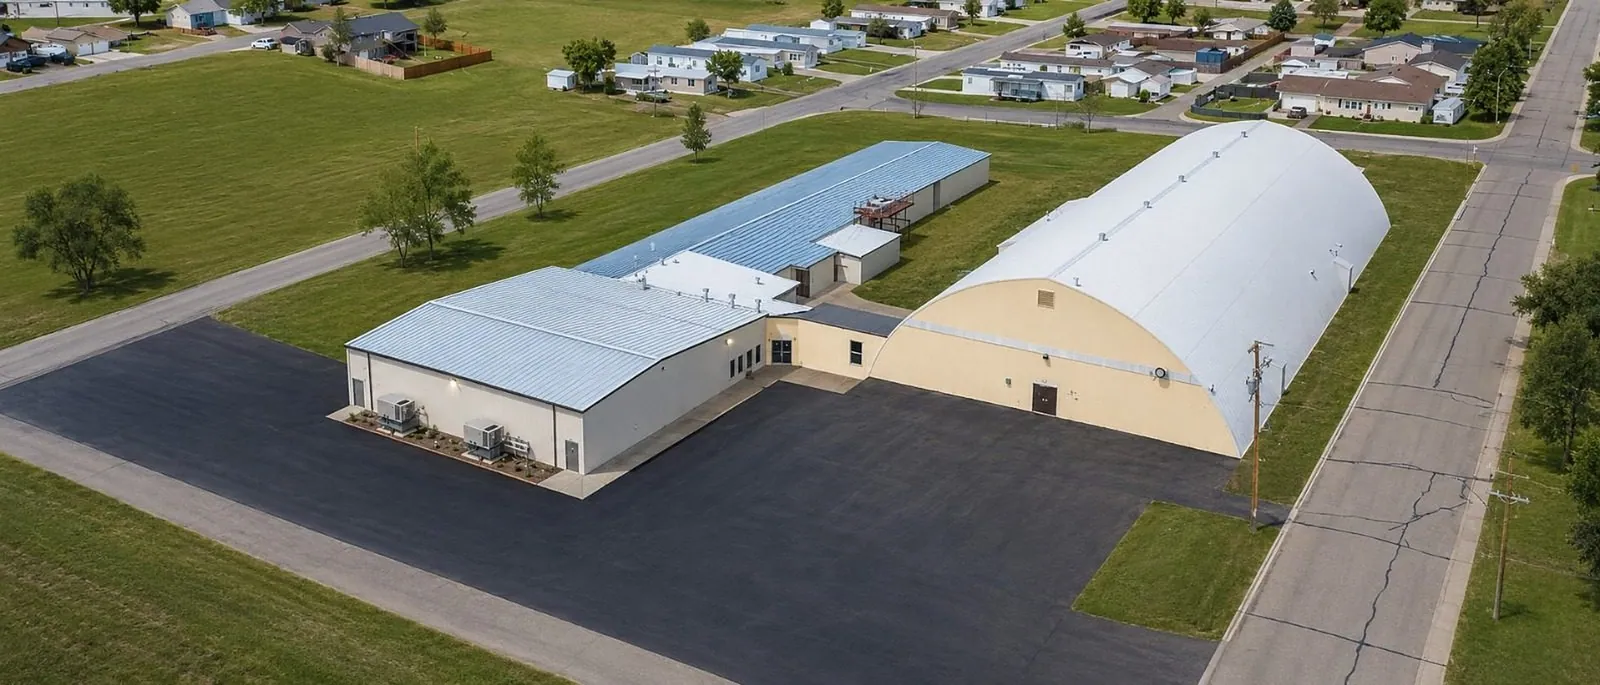
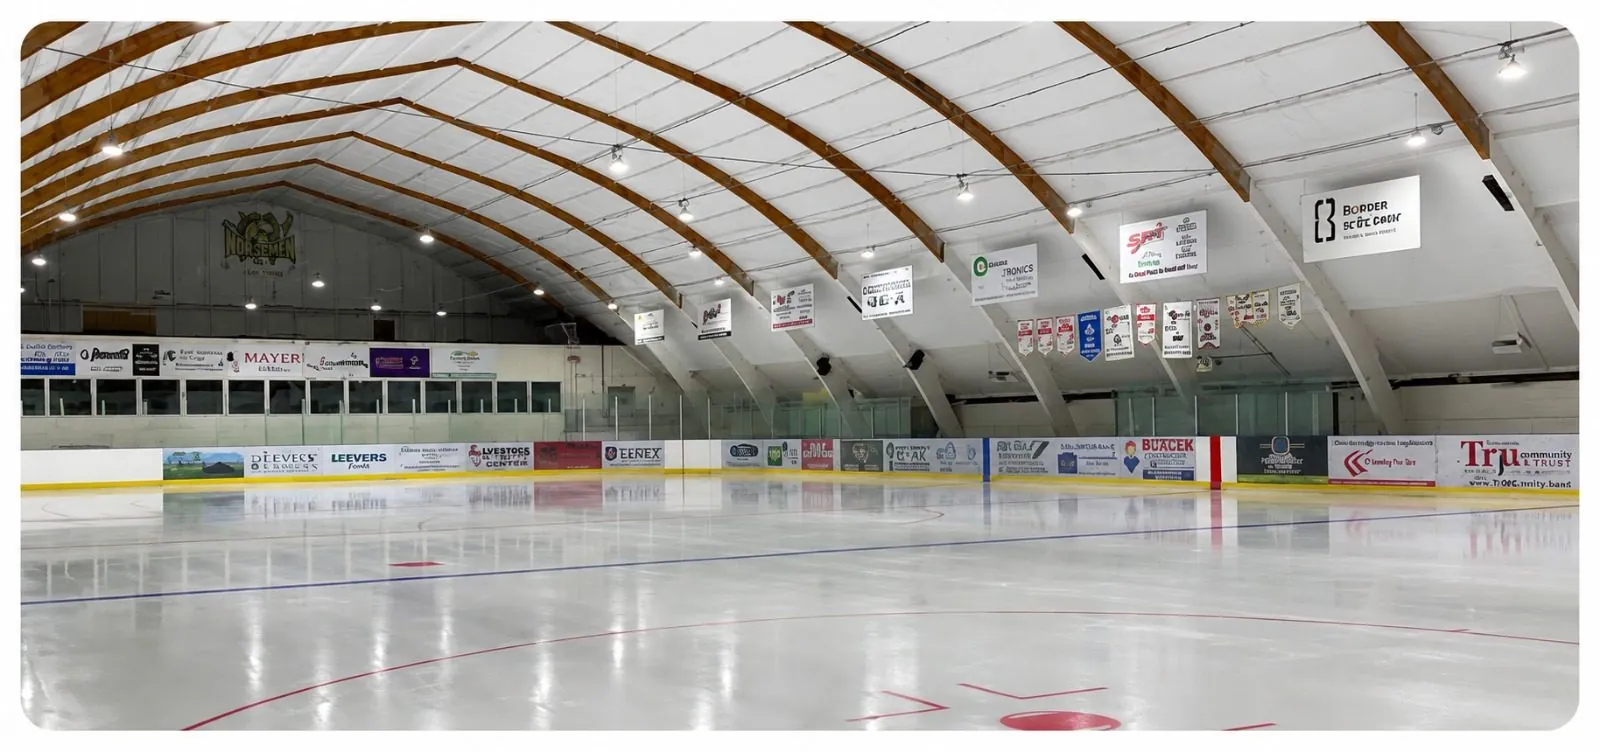
The Repsol Community Center is a large municipal recreation facility supporting arena operations, public activity, lighting, ventilation, kitchen services, and year-round programming.

While utility bills showed total consumption, they provided little insight into how the facility was actually behaving day-to-day. Smaller operational inefficiencies, continuous support loads, and systems operating beyond demand remained largely hidden behind monthly energy totals.

Facility Background

Facility Name
Respol Community Center
Facility Type
Municipal Indoor Arena
Facility Age
1980
Facility Size
50,000 ft2
Respol Community Center

The Problem

The Facility Seemed Fine — But Energy Costs Said Otherwise

The arena’s systems appeared to be operating normally, but overall energy usage continued telling a different story.

Daily operations shifted constantly based on occupancy, vents, ice schedules, and seasonal demand making it difficult to understand what was actually driving costs.

Utility bills showed total consumption, but they couldn’t reveal hidden operational waste, unnecessary runtime, or which systems were quietly increasing demand behind the scenes.

The Discovery

The Biggest Energy Losses Were Hidden in Daily Operations

Once Opti-mized introduced circuit-level visibility, the facility began revealing operational patterns that had previously gone unnoticed.

The system identified 64 separate areas of energy loss across the arena, including unnecessary runtime, off-hours consumption, and systems operating beyond expected demand.

The analysis uncovered an estimated 15.9% overall energy savings opportunity — showing how smaller inefficiencies across daily operations were quietly driving operating costs higher over time.

The Impact

Small Inefficiencies Were Quietly Driving Operating Costs

The discoveries showed that a significant amount of energy use was tied to operational behavior that had previously gone unnoticed.

Systems were operating longer than required, energy was being consumed during lower-demand periods, and smaller inefficiencies across the arena were accumulating into avoidable operating costs.

Rather than one major issue, the analysis revealed multiple hidden patterns contributing to unnecessary energy usage throughout daily operations.

The Shift

Operational Visibility Replaced Assumptions

With clearer visibility into how the facility was actually operating, decision-making became more informed and targeted.

Facility operations could now be understood beyond utility totals alone, allowing operational behavior, runtime patterns, and energy use to be viewed with greater clarity.

Instead of relying on assumptions, the arena gained a measurable understanding of where energy was going and where opportunities for improvement existed.

Opti-mized

Why it Matters

Utility Bills Show Totals — Not What’s Actually Happening


Most facilities operate with limited visibility into how energy is truly being used day to day.

Utility bills can show overall consumption, but they cannot explain which systems are responsible, when energy is being wasted, or how operational behavior impacts costs.

Opti-mized was built to uncover the operational story behind facility energy use — helping facilities move beyond assumptions and gain real visibility into performance, inefficiencies, and day-to-day behavior.

Smarter Energy Usage


15.9%

Energy Savings

2.3Years

ROI Period

64

Energy Loss Areas

Energy Loss Types Explained

64Areas of
Energy Loss

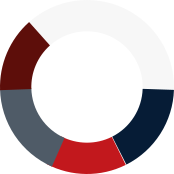
Opti-mized detected 64 instances of energy loss across four main categories. Each represents hidden costs that add up quickly.

Energy loss breakdown chart

Energy Loss Detected


  • Off-Hours:
  • On-Hours Overusage:
  • Standby / Idle:
  • High Continuous Loads:

Off-Hours Waste

Energy used when facilities are closed or unoccupied — systems left running overnight, on weekends, or during downtime.

On-Hours Overusage

Extra energy consumed during regular operating hours — systems drawing more power than necessary for the activity taking place.

Standby / Idle Loads

Power used by systems that remain on or in standby mode even when they’re not actively being used.

High Continuous Loads

Systems that run at high levels for long stretches without adjustment, even when demand is lower.


The Biggest Energy Costs Rarely Look Big

Small Inefficiencies Became Expensive Fast


Most facilities don’t lose energy through one obvious issue.
They lose it through dozens of small operational behaviors happening every day:

  • Systems running longer than needed
  • Lights staying active after-hours
  • Support equipment operating continuously
  • Small loads quietly accumulating month after month. Utility bills show totals.

Operational visibility shows what’s actually causing them.

See What Was Actually Driving Costs

This Isn’t About More Data

Facilities Needed Answers, Not More Graphs


Most facilities already have data.
What they lack is visibility into how the facility is actually behaving.
Opti-mized helps uncover:

  • Where energy is being lost
  • Which systems never truly shut down
  • What runs longer than expected
  • and Which operational patterns quietly increase costs every month

The goal isn’t more graphs.
It’s understanding what deserves attention first.

See What The Facility Couldn’t See

Small Operational Waste Becomes Big Fast

How “Normal” Operations Increased Costs


One light left on overnight doesn’t seem important.
Neither does:

  • A fan running longer than necessary
  • A plug load that never shuts off
  • Or a support system operating continuously

But across dozens of circuits, every day, every month —
those small operational behaviors quietly compound into major operating costs.

See How The Waste Accumulated

The Facility Wasn’t Broken. It Was Bleeding.

Everything's Running - That's the Problem


The hardest energy waste to detect is the kind that looks normal.

  • Small runtime overruns.
  • Continuous plug loads.
  • Support systems operating without demand.

Individually, they barely stand out.
Together, they quietly drive thousands in avoidable operating costs over time.

See What Was Quietly Driving Costs

See How Much Energy You’re Losing — And How Much You Can Recover

Get a personalized Money-Loss Report showing where energy is likely going, what’s causing it, and the biggest opportunities for savings.

  • Energy Use Breakdown
  • Operational Insights
  • Savings Opportunities

Free · No hardware required · Takes only a few minutes

Money-Loss Report preview
Hidden Cost Detected

Most facilities are wasting roughly 5–20% of their energy spend without knowing it.

Stay Informed

Stay Ahead with Opti-mized

Get early access to insights, product updates, and new opportunities to better understand and improve facility performance.

  • Insights
  • Platform Updates
  • Opportunities